- 1 A Little History: Where It All Began
- 2 Understanding the Basic Differences
- 3 Conventional PCR: Amplifying a Specific DNA Sequence
- 4 qPCR: Monitoring DNA Amplification in Real Time
- 5 RT-PCR: When the Starting Material Is RNA
- 6 Side-by-Side Comparison: PCR vs qPCR vs RT-PCR vs RT-qPCR
- 7 Which Technique Should You Choose?
- 8 Common Technical Pitfalls in PCR Workflows
- 9 Final Thoughts
If you have spent some time in a microbiology or molecular biology laboratory, you have probably heard researchers use the terms PCR, qPCR, and RT-PCR. They sound almost identical, and to someone who is just starting out, it can be difficult to understand why laboratories use different techniques when all of them involve amplifying genetic material.
The confusion becomes even greater when someone mentions RT-qPCR. Is it another version of PCR? Is it the same as real-time PCR? And why do we need reverse transcription in the first place?
Although these techniques share the same basic amplification principle, they are designed to answer very different biological questions:
- One helps determine whether a particular DNA sequence is present or absent.
- Another measures how much of that sequence is in a sample.
- The third allows researchers to work with RNA molecules.
Understanding these differences is foundational in microbiology because PCR-based methods are now routinely used for bacterial identification, viral diagnosis, antibiotic resistance screening, gene expression profiling, and many other diagnostic workflows.
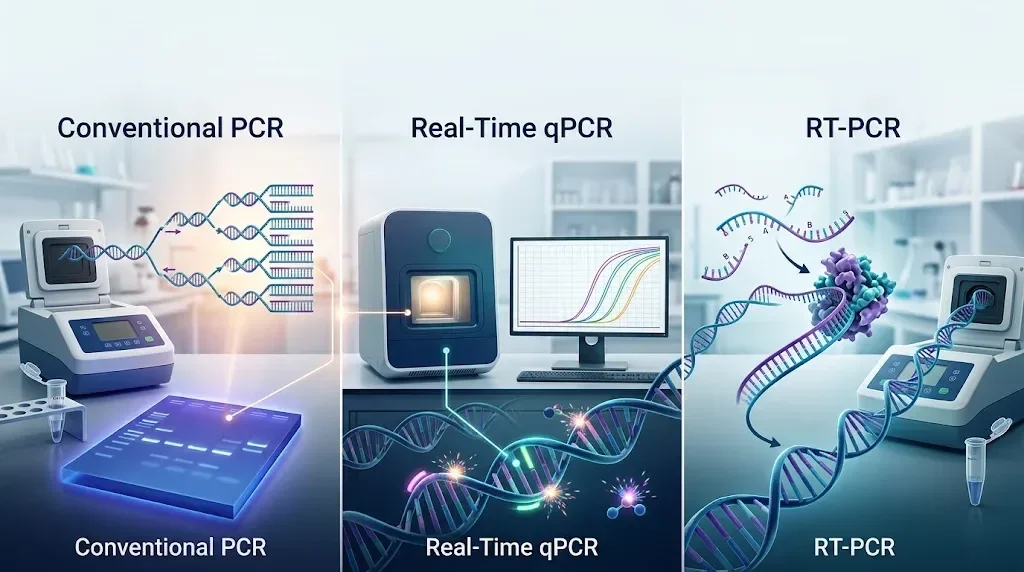 Figure 1. Comparison of molecular amplification workflows: Conventional PCR (endpoint agarose gel), Real-Time qPCR (fluorometric amplification curve), and RT-PCR (reverse transcription of RNA to cDNA).
A Little History: Where It All Began
Before PCR became widely available, working with minute quantities of DNA was a formidable challenge. Researchers frequently needed large amounts of cellular material to perform experiments, which made detecting rare DNA sequences exceptionally difficult.
That changed in 1983, when Kary Mullis conceived the polymerase chain reaction (PCR). The technique provided a way to selectively amplify a target DNA region, producing billions of copies from a microscopic starting template. Mullis was awarded the 1993 Nobel Prize in Chemistry for this breakthrough.
Early PCR had a significant practical bottleneck: the DNA polymerase originally used could not survive repeated heating cycles. Researchers had to manually replenish fresh enzyme after each denaturation step.
A transformative improvement came with the isolation of Taq DNA polymerase from Thermus aquaticus, a thermophilic bacterium native to geothermal hot springs. Because Taq withstands the 95°C temperatures required for strand separation, it enabled automated thermal cycling in programmable machines.
Researchers subsequently developed ways to monitor DNA accumulation while the reaction was actively progressing. This gave rise to real-time PCR (quantitative PCR, or qPCR). Later, the adaptation of retroviral reverse transcriptase enabled the conversion of RNA into complementary DNA (cDNA), establishing RT-PCR and unlocking the study of RNA viruses and active cellular gene transcription.
Understanding the Basic Differences
Before examining each method in technical detail, it helps to identify the fundamental question each assay is engineered to answer:
| Technique | Starting Material | Main Purpose | Readout Type |
|---|---|---|---|
| Conventional PCR | DNA | Detect whether a specific DNA sequence is present | Qualitative (End-point gel band) |
| qPCR | DNA | Measure and quantify DNA accumulation cycle-by-cycle | Quantitative (Real-time fluorescence / Ct) |
| RT-PCR | RNA | Reverse transcribe RNA into cDNA and amplify it | Qualitative (End-point gel band) |
| RT-qPCR | RNA | Convert RNA into cDNA and quantify amplification in real time | Quantitative (Relative expression or viral load) |
The critical distinction is that reverse transcription describes how RNA is converted into DNA, whereas real-time PCR describes how amplification is monitored. They are not mutually exclusive; in fact, they are routinely merged into a single assay (RT-qPCR).
Conventional PCR: Amplifying a Specific DNA Sequence
Conventional PCR is the foundation of molecular diagnostic testing. Its goal is straightforward: take a tiny amount of DNA and make enough copies of a defined region to detect, size, or sequence it.
For instance, consider a clinical isolate suspected of carrying a specific carbapenemase or methicillin resistance gene (mecA). Because the raw bacterial colony provides a limited number of genomic copies, PCR is used to amplify the target gene millions of times so that it can be clearly evaluated.
What Goes into a PCR Reaction?
Every PCR reaction relies on a balanced cocktail of biochemical components:
| Component | Function |
|---|---|
| Template DNA | Contains the target sequence to be amplified |
| Forward & Reverse Primers | Short oligonucleotides (18–25 bp) that define the exact amplification boundaries |
| dNTPs | Equimolar mixture of dATP, dCTP, dGTP, and dTTP providing the building blocks for new DNA |
| Taq DNA Polymerase | Thermostable enzyme that synthesizes the nascent DNA strand |
| Mg²⁺ ions (MgCl₂) | Essential catalytic cofactor that stabilizes enzyme-substrate interactions |
| Reaction Buffer | Maintains optimum pH (8.3–8.8) and ionic strength |
What Happens During a PCR Cycle?
A standard PCR protocol consists of 25 to 40 repeated thermal cycles, each comprising three distinct phases:
- Denaturation (94–95°C): High thermal energy breaks hydrogen bonds between antiparallel strands, converting double-stranded DNA into single-stranded templates.
- Annealing (50–65°C): The temperature is lowered to allow forward and reverse primers to hybridize specifically to their complementary target sites. The exact temperature depends on primer length and base composition (melting temperature, Tm).
- Extension (72°C): Taq polymerase synthesizes complementary DNA strands by adding free dNTPs in the 5′ to 3′ direction from the 3′-OH end of each primer.
In an idealized reaction, the quantity of target DNA doubles during every cycle:
Exponential Amplification Formula:
Nn = N0 × 2n
Where N0 is the initial copy number, and n is the total number of completed cycles.
Under ideal conditions, a single starting copy could theoretically yield approximately 1.07 billion copies after 30 cycles. In practice, however, enzyme degradation, primer depletion, and pyrophosphate accumulation eventually cause the reaction to plateau.
Analyzing the Amplified Product
Conventional PCR is an end-point assay: the reaction must run to completion before results can be visualized.
The amplified products are separated using agarose gel electrophoresis. An electric current drives negatively charged DNA fragments through an agarose matrix toward the positive anode. Smaller fragments migrate faster than larger ones.
By comparing the resulting band with a calibrated DNA molecular weight ladder under ultraviolet or blue light, researchers confirm whether a product of the expected size was formed.
qPCR: Monitoring DNA Amplification in Real Time
Quantitative PCR (qPCR), commonly called real-time PCR, uses the same enzymatic amplification cycles as conventional PCR. The critical innovation is that qPCR tracks the accumulation of amplified DNA during every individual cycle using fluorescence.
Instead of running an agarose gel at the conclusion of the run, a specialized real-time thermocycler excites fluorophores in the reaction tube and measures emitted light after each extension step. This produces an amplification curve that directly correlates with the starting template concentration.
Detection Chemistries: SYBR Green vs. TaqMan
The fluorescent signal in qPCR is generated primarily through two distinct chemistries:
| Feature | SYBR Green I Chemistry | TaqMan Hydrolysis Probes |
|---|---|---|
| Mechanism | Intercalates into the minor groove of double-stranded DNA | Sequence-specific oligonucleotide labeled with reporter and quencher dyes |
| Specificity | Binds all dsDNA (including primer-dimers and non-specific products) | High sequence specificity; requires three distinct hybridization events |
| Cost | Relatively low; universal dye | Higher; requires custom synthesis of dual-labeled probes |
| Multiplexing | Highly limited in a single tube | Readily multiplexed by labeling probes with distinct fluorophores (e.g., FAM, VIC, Cy5) |
| Post-PCR Validation | Melt curve analysis is required to verify single-peak specificity | Melt curve analysis is generally unnecessary |
Understanding the Threshold Cycle (Ct or Cq)
The central quantitative metric in qPCR is the cycle threshold (Ct), also termed quantification cycle (Cq):
The Golden Rule of qPCR:
A lower Ct value indicates a higher starting concentration of target DNA.
A higher Ct value indicates a lower starting concentration of target DNA.
Consider two clinical samples tested with the same validated assay:
- Sample A crosses the fluorescence threshold at cycle 18.
- Sample B crosses the fluorescence threshold at cycle 28.
Because Sample A reached detectable signal 10 cycles earlier, it contained vastly more starting target DNA. Under 100% amplification efficiency, a difference of 3.32 cycles represents a 10-fold difference in template abundance.
Phases of the qPCR Amplification Curve
A standard real-time amplification curve exhibits four distinct zones:
- Baseline Phase (Cycles 1–15): Fluorescence is below the instrument detection limit and reflects background noise.
- Exponential Phase: The reaction operates at maximum efficiency (doubling every cycle). The threshold line is set within this geometric window to calculate reliable Ct values.
- Linear Phase: Reagents become rate-limiting, and amplification slows.
- Plateau Phase: Substrates are exhausted; no further increase in signal occurs. Endpoint fluorescence does not reliably reflect starting template copy numbers.
Measuring Relative Gene Expression: The 2−ΔΔCt Method
When measuring gene expression, qPCR data are commonly analyzed using the comparative 2−ΔΔCt method (Livak & Schmittgen, 2001):
- Calculate ΔCt for each sample:
ΔCt = Ct(Target Gene) − Ct(Reference / Housekeeping Gene) - Calculate ΔΔCt between experimental and control conditions:
ΔΔCt = ΔCt(Treated) − ΔCt(Untreated Control) - Calculate relative fold change:
Fold Change = 2−ΔΔCt
Example: If a drug-treated bacterial culture produces a ΔΔCt of −3 for an efflux pump gene:
Fold Change = 2−(−3) = 23 = 8-fold upregulation.
RT-PCR: When the Starting Material Is RNA
Conventional DNA polymerases cannot synthesize DNA directly from an RNA template. However, many important biological targets exist as RNA:
- RNA viruses: SARS-CoV-2, Influenza A/B, Hepatitis C virus (HCV), Dengue, Rabies, and HIV.
- Transcriptomes: Messenger RNA (mRNA) transcripts expressing bacterial virulence factors or cellular cytokines.
To amplify RNA, scientists use reverse transcriptase—an RNA-dependent DNA polymerase derived from retroviruses such as Moloney Murine Leukemia Virus (M-MLV) or Avian Myeloblastosis Virus (AMV).
The Two-Stage Process
- Reverse Transcription (RT): The enzyme synthesizes a single-stranded complementary DNA (cDNA) strand from the RNA template.
- PCR Amplification: Standard Taq DNA polymerase and specific primers amplify the newly synthesized cDNA.
Selecting Primers for Reverse Transcription
| Primer Type | What It Recognizes | Optimal Application |
|---|---|---|
| Oligo(dT) Primers | Stretches of deoxythymidines that hybridize to poly(A) tails | Eukaryotic mRNA expression profiling |
| Random Hexamers | Short random 6-nucleotide sequences that bind across the entire RNA molecule | Total RNA, non-polyadenylated transcripts, or partially degraded RNA |
| Gene-Specific Primers | A unique sequence complementary only to the target transcript | Targeted viral RNA detection or one-step diagnostic assays |
One-Step vs. Two-Step RT-PCR
- One-Step RT-PCR: Reverse transcription and PCR amplification take place sequentially in the same tube using a blended enzyme master mix. This minimizes pipetting errors and reduces cross-contamination risk, making it the preferred format for high-throughput clinical viral screening.
- Two-Step RT-PCR: cDNA synthesis is conducted in an initial reaction, after which aliquots of cDNA are distributed into multiple independent PCR tubes. This provides maximal flexibility to screen multiple target genes from a single clinical specimen.
Side-by-Side Comparison: PCR vs qPCR vs RT-PCR vs RT-qPCR
| Feature | Conventional PCR | Real-Time qPCR | RT-PCR | RT-qPCR |
|---|---|---|---|---|
| Starting Material | DNA | DNA | RNA | RNA |
| Reverse Transcription Step | No | No | Yes (RNA → cDNA) | Yes (RNA → cDNA) |
| Monitoring Mode | End-point | Real-time | End-point | Real-time |
| Detection Method | Agarose gel electrophoresis | In-line fluorescence | Agarose gel electrophoresis | In-line fluorescence |
| Primary Data Output | Qualitative (Band presence/size) | Quantitative (Ct value / copy #) | Qualitative (Band presence/size) | Quantitative (Ct / relative fold change) |
| Multiplexing Capacity | Sizing differences on gel | Multiple dye channels | Sizing differences on gel | Multiple dye channels |
| Typical Microbiology Use | Pathogen screening & 16S sequencing | Bacterial load & gene copy quantification | RNA viral genotyping & cloning | Viral load testing (e.g., SARS-CoV-2, HIV) & gene expression |
Which Technique Should You Choose?
Selecting the appropriate method depends on your experimental objective:
- “Is the target gene present in my bacterial isolate?”
→ Choose Conventional PCR. - “How many copies of this bacterial or viral DNA sequence are present?”
→ Choose qPCR. - “Do I need to amplify an RNA virus or clone an expressed gene?”
→ Choose RT-PCR. - “How much viral RNA is in this patient sample, or how significantly has treatment altered gene transcription?”
→ Choose RT-qPCR.
Common Technical Pitfalls in PCR Workflows
Even well-designed experiments can fail due to technical nuances:
- Contamination & Aerosols: PCR can amplify a single contaminant molecule. Separate clean pre-PCR reagent preparation hoods from post-PCR analysis areas, utilize filter tips, and include No-Template Controls (NTC).
- Genomic DNA Contamination in RNA Assays: In RT-qPCR, contaminating host or bacterial DNA can produce false-positive signals. Treat samples with DNase I and incorporate a No-RT control (reaction without reverse transcriptase) to verify that amplification is strictly RNA-dependent.
- Suboptimal Annealing Temperatures: Temperatures set too low encourage non-specific annealing and primer-dimer artifacts, while temperatures set too high prevent primer binding. Use gradient thermal cycling to empirically determine the optimal Ta.
- RNA Degradation: Unlike robust double-stranded DNA, single-stranded RNA is rapidly degraded by ubiquitous environmental RNases. Always verify RNA integrity (e.g., Bioanalyzer RIN ≥ 7) prior to downstream cDNA synthesis.
Final Thoughts
While conventional PCR, qPCR, and RT-PCR are built upon the same fundamental principle of enzymatic nucleic acid copying, they serve distinct analytical roles in the modern laboratory. Conventional PCR provides qualitative confirmation, qPCR delivers quantitative precision, RT-PCR unlocks RNA biology, and RT-qPCR combines reverse transcription with real-time tracking for clinical diagnostics.
Understanding these mechanisms empowers microbiologists, diagnostic laboratory technicians, and biomedical researchers to select the right tool for every biological question.