- 1 1. First, Understand What a Missing Band Actually Means
- 2 2. Poor-Quality or Insufficient DNA Template
- 3 3. Incorrect Primer Design or Primer Annealing
- 4 4. Annealing Temperature is Too High or Too Low
- 5 5. Suboptimal Magnesium Concentration (Mg2+)
- 6 6. Missing or Inactive PCR Reagents
- 7 7. Suboptimal Denaturation, Extension, or Cycle Number
- 8 8. GC-Rich DNA Regions and Secondary Structures
- 9 9. Chemical PCR Inhibitors
- 10 10. The PCR Succeeded, But the Gel Failed
- 11 11. Practical Troubleshooting Matrix
- 12 12. Systematic 7-Step Workflow for PCR Troubleshooting
- 13 13. Laboratory Best Practices to Prevent PCR Failures
- 14 Final Thoughts
You have extracted the DNA, designed your primers, prepared the PCR master mix, and carefully programmed the thermal cycler. After waiting for the reaction to finish, you load the PCR products onto an agarose gel, start electrophoresis, and finally check the transilluminator image. But there is a problem: there are no visible DNA bands.
It is one of the most frustrating moments in molecular biology, particularly when you have spent hours preparing precious samples or are working with a difficult diagnostic target. The first reaction is often to blame the DNA template or assume that the primers are non-functional. However, PCR failure is rarely that straightforward.
Conventional polymerase chain reaction (PCR) depends on several biochemical components working synchronously. A problem with primer binding, magnesium concentration, template DNA integrity, DNA polymerase activity, or thermal cycling parameters can prevent amplification entirely. Even when the PCR itself has successfully amplified the target, problems with gel preparation, staining, or UV/blue-light imaging can render the expected product invisible.
The good news is that most PCR failures can be investigated systematically. Instead of changing several reaction conditions at once and repeating the same experiment blindly, it is far more effective to identify where the amplification process broke down. In this guide, we will examine the most common reasons for getting no bands on an agarose gel, explain how to diagnose each problem, and outline practical solutions to optimize conventional PCR results.
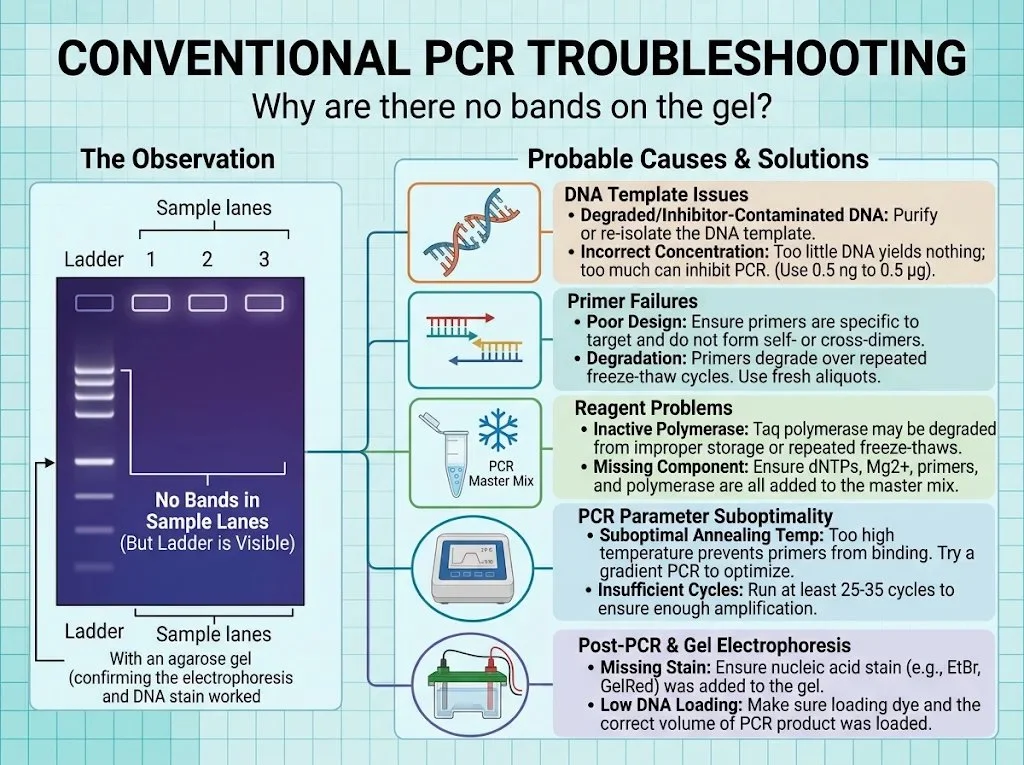
Figure 1: Overview of conventional PCR troubleshooting when sample lanes show no bands while the molecular weight ladder remains visible.
1. First, Understand What a Missing Band Actually Means
Before modifying your PCR conditions, carefully evaluate your initial observation. A missing band simply means that no detectable PCR product was observed at the expected molecular weight position on the gel. It does not definitively prove that zero amplification occurred:
- Sub-detection Yields: The reaction may have amplified a very small amount of product that falls beneath the sensitivity threshold of your nucleic acid staining method (e.g., standard ethidium bromide vs. high-sensitivity GelRed/SYBR Safe).
- Aberrant Amplicon Size: The product may have migrated to an unexpected size due to alternate splicing, non-specific binding, or genomic rearrangements.
- Electrophoretic or Imaging Errors: The gel may have been improperly cast, over-electrophoresed, or imaged under incorrect filter/illumination wavelengths.
This distinction is crucial because your troubleshooting strategy hinges on the root observation.
A useful first step is to examine the entire gel field rather than glancing only at the expected product position:
- Is the DNA ladder visible and crisp? (If not, your problem lies in gel preparation, stain incorporation, or imaging).
- Are the sample wells intact? (Leaking or torn wells lose product into the buffer).
- Is there a faint diffuse band or smudge near the bottom of the gel? (This indicates primer-dimers, confirming that the polymerase and cycling worked, but primers targeted each other instead of the template).
- Are there unexpected higher-molecular-weight smears? (Indicates non-specific binding, template overloading, or genomic DNA carryover).
- Did the positive control amplify? (If the positive control fails, reagents or cycling are defective).
- Is the no-template control (NTC) clean? (Ensures reagents are free of contamination).
2. Poor-Quality or Insufficient DNA Template
The DNA template provides the target sequence that primers must recognize, bind, and extend. If the template is degraded, contaminated with extraction residues, or present in suboptimal amounts, PCR amplification can fail entirely.
Crucially, DNA concentration alone does not tell you whether a sample is suitable for PCR. A sample may show an impressive spectrophotometric reading yet harbor chemical inhibitors that completely stall DNA polymerase.
Common Template Problems
- Insufficient DNA Template: If too little target DNA is added, the reaction cannot generate enough amplicon copies within 30–35 cycles to form a visible band. This is particularly prevalent when amplifying single-copy genomic loci from limited clinical biopsies.
- Degraded DNA: Exposure to endogenous nucleases, excessive heat, formalin fixation (FFPE), or repeated freeze-thaw cycles shears DNA into small fragments. If the template fragment length is shorter than your expected amplicon, amplification cannot occur.
- Contaminated DNA: Residual lysis reagents, chaotic salts (guanidinium thiocyanate), ethanol wash carryover, phenol, or cellular proteins directly inhibit the enzymatic activity of DNA polymerases.
Troubleshooting Template Failures
- Assess Concentration and Purity: Use spectrophotometry (NanoDrop) and fluorometry (Qubit). Double-stranded DNA absorbs maximally at 260 nm. An A260/A280 ratio of ~1.8 and A260/A230 ratio between 2.0–2.2 represent pure DNA. A low 260/280 ratio (<1.6) indicates protein or phenol contamination; a low 260/230 ratio (<1.5) signals salt or carbohydrate carryover.
- Perform a Template Dilution Series: If chemical inhibition is suspected, test 1:5, 1:10, and 1:50 dilutions of the template in nuclease-free water while keeping the template volume added to the master mix constant. Dilution lowers both target DNA and inhibitor concentration; if a 1:10 dilution produces a robust band where the neat template yielded nothing, PCR inhibition is confirmed.
- Template Cleanup or Re-isolation: If degradation or heavy inhibitor carryover is present, re-isolate DNA using spin-column protocols with thorough ethanol dry-spins, or perform an enzymatic cleanup/ethanol precipitation.
3. Incorrect Primer Design or Primer Annealing
Primers define the boundaries of your amplicon. Even with pristine template DNA, poorly designed or synthesized oligonucleotides can completely prevent successful amplification. For DNA polymerase to synthesize new strands, forward and reverse primers must anneal specifically to opposite strands with their 3′ hydroxyl (-OH) termini facing inward toward one another.
Common Primer Failures
- Incorrect Target Sequence: Primers designed against an outdated reference assembly, an alternate splice variant, or without accounting for single nucleotide polymorphisms (SNPs) in the binding region may fail to hybridize.
- Tm Mismatch: If the melting temperatures (Tm) of the forward and reverse primers differ by more than 3–5°C, finding an annealing temperature that allows both primers to bind efficiently without non-specific priming becomes extremely difficult.
- Secondary Structures and Primer-Dimers: Primers can fold into internal hairpin loops or hybridize to each other (cross-dimers or self-dimers). Complementarity at the 3′ ends is especially fatal, as the polymerase will prioritize extending primers over amplifying the target, yielding low-molecular-weight bands (~30–80 bp) and an empty target lane.
- Poor Specificity: Primers that match multiple homologous loci across a complex genome can dilute polymerase activity across hundreds of genomic sites, leaving no single discernible band.
Troubleshooting Primer Issues
- Re-evaluate oligonucleotide designs in silico using tools like NCBI Primer-BLAST or OligoEvaluator.
- Confirm primer orientation: the forward primer matches the sense strand (5′→3′), while the reverse primer matches the reverse complement of the target region.
- Verify primer reconstitution and working stocks. Primers stored in water at 4°C can undergo depurination; maintain stocks at −20°C in TE buffer (10 mM Tris-HCl, 0.1 mM EDTA, pH 8.0).
4. Annealing Temperature is Too High or Too Low
During the annealing step of thermal cycling, primers must navigate Brownian motion to hybridize to their complementary single-stranded DNA targets. The thermal window must balance thermodynamic stability against stringency.
- Annealing Temperature Too High: If Tanneal is set higher than the primer Tm, thermal kinetic energy prevents stable hydrogen bonding between the primer and template. As a consequence, primers cannot anneal, extension never initiates, and no band is produced.
- Annealing Temperature Too Low: While lower temperatures promote binding, they eliminate hybridization stringency, encouraging primers to anneal to partially complementary sites. This produces extensive non-specific banding, smears, or sequesters reagents away from the target amplicon.
Optimization Strategy: Thermal Gradient PCR
The standard starting recommendation is:
Tanneal = Tm(lower primer) − (3 to 5°C)
(Note: High-fidelity master mixes with specialized buffers, such as Phusion or Q5, frequently require annealing at Tm + 3°C; always consult manufacturer-specific calculators).
Run a gradient PCR spanning 8–12 reaction wells across a temperature spectrum (e.g., 52°C to 66°C):
- No bands across high temperatures: Confirms overly stringent annealing.
- Single sharp band at intermediate temperatures: Identifies optimal thermodynamic window.
- Multiple non-specific bands at lower temperatures: Confirms loss of binding stringency.
5. Suboptimal Magnesium Concentration (Mg2+)
Divalent magnesium ions (Mg2+) act as an indispensable catalytic cofactor for Taq DNA polymerase. Magnesium coordinates with the alpha-phosphate groups of incoming dNTPs and stabilizes the negatively charged phosphodiester backbone of the template-primer duplex.
- Mg2+ Too Low (<1.0 mM): The DNA polymerase lacks the essential catalytic cofactor, resulting in dramatically reduced enzymatic processivity, weak bands, or zero amplification.
- Mg2+ Too High (>3.5–4.0 mM): Excess magnesium overly stabilizes double-stranded DNA, preventing complete denaturation and reducing primer binding specificity, leading to heavy smears or misprimed artefacts.
Crucial Interaction: Deoxynucleotide triphosphates (dNTPs) bind Mg2+ in an equimolar 1:1 stoichiometry. If you increase dNTP concentrations in an attempt to boost yield without increasing MgCl2, you will inadvertently starve the polymerase of free magnesium ions!
Troubleshooting Magnesium Levels
Most standard Taq buffers supply MgCl2 at a fixed 1.5 mM concentration (in a 1× reaction). If using a magnesium-free buffer system, titrate MgCl2 in 0.5 mM increments from 1.0 mM to 3.5 mM to identify the optimum. Always verify whether your commercial 10× buffer or 2× master mix already contains MgCl2 before adding supplemental salt.
6. Missing or Inactive PCR Reagents
Because a PCR master mix requires up to eight individual components, pipetting omissions are frequent, especially during manual assembly.
| Reagent / Component | Primary Biochemical Function | Failure Impact When Omitted / Degraded |
|---|---|---|
| Template DNA | Provides target nucleotide sequence | Absolute reaction failure; blank lane |
| Forward Primer | Initiates synthesis on antisense strand | Single-strand linear copying; invisible on gel |
| Reverse Primer | Initiates synthesis on sense strand | Single-strand linear copying; invisible on gel |
| DNA Polymerase | Catalyzes 5′→3′ phosphodiester extension | Zero product; complete reaction silence |
| dNTP Mix (dATP, dCTP, dGTP, dTTP) | Building blocks for nascent strands | Polymerase cannot extend; zero amplification |
| Mg2+ (MgCl2) | Essential divalent enzymatic cofactor | Inactive polymerase; unhybridized primers |
| Reaction Buffer (with Tris/KCl) | Maintains optimal pH (8.3–8.8) & ionic strength | Enzyme denaturation or severe kinetic penalty |
| Nuclease-Free Water | Balances osmotic volume | High salt concentrations inhibit reaction |
Reagent Quality Checklist
- Taq DNA Polymerase: Always transport on a benchtop cooling block. Avoid repeated freeze-thaw cycles or prolonged exposure to room temperature. If enzyme activity is suspect, run a control reaction with known stock plasmids and validated primers.
- dNTPs: Extremely sensitive to freeze-thaw degradation. Prepare small, single-use aliquots (10 mM each) to avoid freeze-thawing the master stock more than 3–5 times.
- Buffer Precipitates: Vortex 10× PCR buffers thoroughly prior to pipetting; magnesium salts often precipitate upon freezing and form concentration gradients inside the microcentrifuge tube.
7. Suboptimal Denaturation, Extension, or Cycle Number
An incompatible thermal cycler profile will abort amplification regardless of reagent quality.
Standard 3-Step Conventional PCR Protocol:
┌─────────────────┐ ┌───────────────┐ ┌───────────────┐ ┌─────────────────┐
│ Initial Denat.  │ │ Denaturation  │ │   Annealing   │ │    Extension    │
│ 95°C (2–5 min)  │ │ 95°C (30 sec) │ │ 55–62°C (30s) │ │ 72°C (1 min/kb) │
└─────────────────┘ └───────┬───────┘ └───────┬───────┘ └───────┬─────────┘
                            └─────────────────┴─────────────────┘
                                    Repeat 25–35 Cycles
Critical Profile Checkpoints
- Initial Denaturation: Standard Taq typically requires 95°C for 2–3 minutes to fully unwind complex genomic DNA. “Hot-start” chemically modified polymerases require 10–15 minutes at 95°C to cleave inhibitory chemical crosslinks; starting amplification without an adequate activation step leaves the enzyme dormant.
- Denaturation Step: Insufficient denaturation time (<20 seconds) or inadequate temperature (<94°C) leaves DNA partially hybridized, preventing primers from accessing target sequences.
- Extension Duration: Standard Taq synthesizes approximately 1,000 base pairs (1 kb) per minute at 72°C. If attempting to amplify a 2.5 kb amplicon with a 45-second extension time, the polymerase will fall off before reaching the opposite primer site, resulting in truncated, non-exponential products.
- Cycle Number: While standard reactions run 28–35 cycles, low-abundance templates may require 35–40 cycles to generate nanogram-level quantities detectable by standard staining dyes.
8. GC-Rich DNA Regions and Secondary Structures
DNA templates exhibiting a guanine-cytosine (GC) content greater than 60–65% pose distinct amplification hurdles. The three hydrogen bonds stabilizing G:C base pairs require substantially more thermal energy to dissociate than A:T pairs.
Furthermore, GC-rich stretches frequently fold into stable secondary hairpins, loops, and G-quadruplex structures that physically stall DNA polymerase progression, leading to premature termination and empty lanes.
Overcoming Difficult & GC-Rich Templates
- PCR Additives: Add 2% to 5% Dimethyl sulfoxide (DMSO) or 1.0 M betaine to the master mix. DMSO lowers the melting temperature of GC-rich duplexes and disrupts secondary structures, allowing primers to bind and polymerase to progress. (Note: DMSO reduces primer Tm by approximately 0.5–1.0°C per 1% added; lower your annealing temperature accordingly).
- Specialized Polymerases: Switch from conventional Taq to engineered high-processivity polymerases formulated with specialized GC enhancers.
- Elevate Denaturation: Increase cyclic denaturation to 98°C for high-fidelity enzymes formulated to withstand elevated thermal stress.
9. Chemical PCR Inhibitors
A DNA sample may exhibit excellent yield on a spectrophotometer, yet harbor chemical contaminants that directly poison the polymerase active site or chelate essential Mg2+ ions.
Common PCR Inhibitors by Sample Origin:
├── Blood & Tissues: Hemoglobin, Heme, Heparin, Lactoferrin, Bile Salts
├── Environmental & Soil: Humic acids, Fulvic acids, Heavy metals
├── Plant Material: Polyphenols, Polysaccharides, Pectin, Tannins
└── Extraction Reagents: Residual Ethanol, Phenol, Chloroform, SDS, EDTA
Diagnosing and Overcoming Inhibition
- The “Spike-In” Control Test: Set up two positive control reactions with verified template and primers. To the second reaction, “spike in” a small aliquot of your problematic test DNA. If the spiked positive control fails to amplify or produces a severely faded band compared to the clean positive control, your sample contains active inhibitors.
- Remediation:
- Dilute the template (1:10 or 1:50). Dilution frequently brings inhibitor levels below the threshold of enzyme inactivation while leaving thousands of target copies available for amplification.
- Add Bovine Serum Albumin (BSA, 0.1–0.4 mg/mL final concentration) to the master mix. BSA scavenges polyphenols, humic acids, and lipids, preventing them from binding to Taq.
- Ensure thorough ethanol drying (centrifuging empty spin columns for 2–3 minutes at max speed) during silica-membrane extractions to eliminate alcohol carryover.
10. The PCR Succeeded, But the Gel Failed
A completely blank gel does not automatically mean the PCR amplification failed. The problem may reside in post-PCR handling, agarose electrophoresis, or nucleic acid visualization.
Gel Electrophoresis Pitfalls
- Ladder is Invisible: If neither your sample lanes nor the DNA molecular weight ladder show any signal, the PCR reaction is not at fault. Either the nucleic acid stain (GelRed, Ethidium Bromide, SYBR Safe) was omitted from the agarose/buffer, the stain was degraded by repeated microwave reheating, or the imaging transilluminator filter was set to the wrong excitation wavelength.
- Reversed Polarity: DNA possesses a net negative charge due to its sugar-phosphate backbone and migrates from the negative cathode (black) toward the positive anode (red). If electrodes were plugged in backwards, your amplicons ran out of the wells and into the top buffer reservoir within 10–15 minutes!
- Low Sensitivity of Staining: Ethidium bromide requires ~1–5 ng of DNA per band for clear UV visualization. Faint amplicons can be completely missed. Post-staining with a high-sensitivity fluorophore like GelGreen or SYBR Gold can reveal bands invisible under standard EtBr.
- Agarose Density Mismatch: A 0.8% agarose gel cannot effectively resolve small 100 bp amplicons (they diffuse rapidly into the buffer), whereas a 2.5% gel will trap large 4 kb products at the well margin. Match your agarose percentage to expected amplicon size (see Table below).
| Expected Amplicon Size | Optimal Agarose Gel Concentration (% w/v in 1× TAE/TBE) |
|---|---|
| 100 – 500 bp | 2.0% – 2.5% |
| 400 – 1,500 bp | 1.5% – 1.8% |
| 800 – 4,000 bp | 1.0% – 1.2% |
| > 4,000 bp | 0.7% – 0.8% |
11. Practical Troubleshooting Matrix
Use this quick-reference decision table to diagnose gel patterns and apply corrective interventions:
| Observation on Gel | Likely Root Cause | Recommended Immediate Action |
|---|---|---|
| No bands anywhere, including ladder | Stain omitted, imaging excitation wrong, or reversed polarity | Check UV/blue light filter; prepare fresh stained gel; verify electrode polarity. |
| Ladder visible; positive control failed; samples blank | Inactive enzyme, degraded dNTPs, or incorrect cycler program | Prepare fresh master mix with new aliquots; verify thermocycler protocol and hot-start settings. |
| Ladder visible; positive control worked; samples blank | Sample template degradation, zero target, or chemical inhibition | Test 1:10 & 1:50 template dilutions; perform spike-in test; re-extract or column-purify DNA. |
| Diluted template amplifies; neat sample blank | Classic PCR inhibition | Dilute test template 1:10 to 1:100; add 0.2 mg/mL BSA to reaction buffer. |
| Blank lane at high Tanneal | Annealing conditions too stringent for primer Tm | Run a thermal gradient (test 2°C increments downward). |
| Smearing across lane or multiple non-specific bands | Annealing temperature too low; template overloaded; excess Mg2+ | Raise Tanneal; reduce template input (to 10–50 ng); reduce MgCl2 concentration. |
| Very faint band of correct size | Low cycle count; suboptimal Mg2+; low template | Increase cycle number from 30 to 35; titrate MgCl2; optimize annealing temperature. |
| Low-molecular-weight band (~30–80 bp) with no product | Severe primer-dimerization | Redesign primers to eliminate 3′ self/cross-complementarity; reduce primer concentration to 0.1–0.2 μM. |
12. Systematic 7-Step Workflow for PCR Troubleshooting
When troubleshooting an uncooperative PCR, never change multiple reaction parameters simultaneously. If you alter primer concentration, magnesium levels, annealing temperature, and template input in a single run, you will not know which change solved or compounded the issue. Follow this disciplined workflow:
Step 1: Inspect Gel & Controls
        ├── Confirm ladder is crisp.
        ├── Check whether positive control amplified.
        └── If ladder/controls failed, troubleshoot gel, stain, or master mix.
Step 2: Validate Reagents & Fresh Aliquots
        ├── Thaw new working vials of primers, dNTPs, and buffer.
        └── Confirm enzyme was kept cold and hot-start requirements were met.
Step 3: Evaluate Template Purity & Run Dilution Series
        ├── Measure A260/A280 and A260/A230.
        └── Test neat, 1:5, and 1:25 template dilutions to unmask inhibition.
Step 4: Thermal Gradient Optimization
        └── Run an annealing gradient across a ±6°C window around theoretical Tm.
Step 5: Magnesium Titration
        └── Test MgCl2 concentrations from 1.0 mM to 3.5 mM in 0.5 mM steps.
Step 6: Test Reaction Additives (for GC/Difficult Targets)
        └── Supplement with 3%–5% DMSO or 1.0 M betaine.
Step 7: Primer Re-design & In Silico Validation
        └── If all steps fail, redesign primers targeting an alternate amplicon window.
13. Laboratory Best Practices to Prevent PCR Failures
Troubleshooting a blank gel is educational, but preventing failure before running reactions saves invaluable time and funding:
- Dedicated Pre-PCR & Post-PCR Zones: Physically isolate reagent preparation (hoods with laminar flow and UV decontamination) from post-PCR gel loading areas to prevent aerosolized amplicon cross-contamination.
- Use Aerosol-Barrier Filter Tips: Prevents accidental barrel contamination of pipettes with trace templates or nucleases.
- Aliquoting Consumables: Aliquot dNTP mixes, primers, and nuclease-free water into single-use or weekly working stocks. Never enter stock vials repeatedly.
- Master Mix Preparation: Always prepare a master mix for N + 1 samples (or 10% excess volume) rather than pipetting individual reagents into separate PCR tubes. This drastically reduces pipetting variance and ensures identical stoichiometry across all tubes.
- Maintain a Rigorous PCR Log: Record primer sequences, lot numbers, master mix recipes, thermal cycling times, and transilluminator photos. When an optimization milestone is reached, documented conditions allow immediate reproducibility.
Final Thoughts
Encountering a blank lane on an agarose gel is a standard challenge in molecular biology, not a sign that your experimental hypothesis is flawed. Conventional PCR is a finely tuned enzymatic process: pristine template DNA cannot overcome cross-dimerizing primers, and the most sophisticated primer pair will fail in the presence of trace extraction salts or inactive polymerase.
By inspecting your controls, methodically ruling out gel electrophoresis artifacts, testing for chemical inhibitors through dilution, and optimizing annealing thermodynamics with a gradient cycler, you can transform PCR troubleshooting from erratic guesswork into a systematic, reproducible laboratory success.